
Data in retail
It is important for an organization to understand which customers are ‘Loyal Customers’ for their business. As, it helps for an organization to build long term relations with such customers. With huge number of customers, organizations are having difficulty in identifying a Loyal Customer.
Objective: The aim is to use the industry’s historic data to build a model which identifies if a current customer is a ‘Loyal Customer’. The provided data set contains the target variable – ‘Active_Customer’, 1 signifies the customer is Loyal and 0 signifies customer is not Loyal.
Data Source: The data was part of an online competition https://rang.shinyapps.io/Competition/
Exploring Data
Following are the Steps which were followed in this analysis :
- Understanding the Dimensions of Data
- Treating missing values
- Analyzing relation between response variable and independent variables
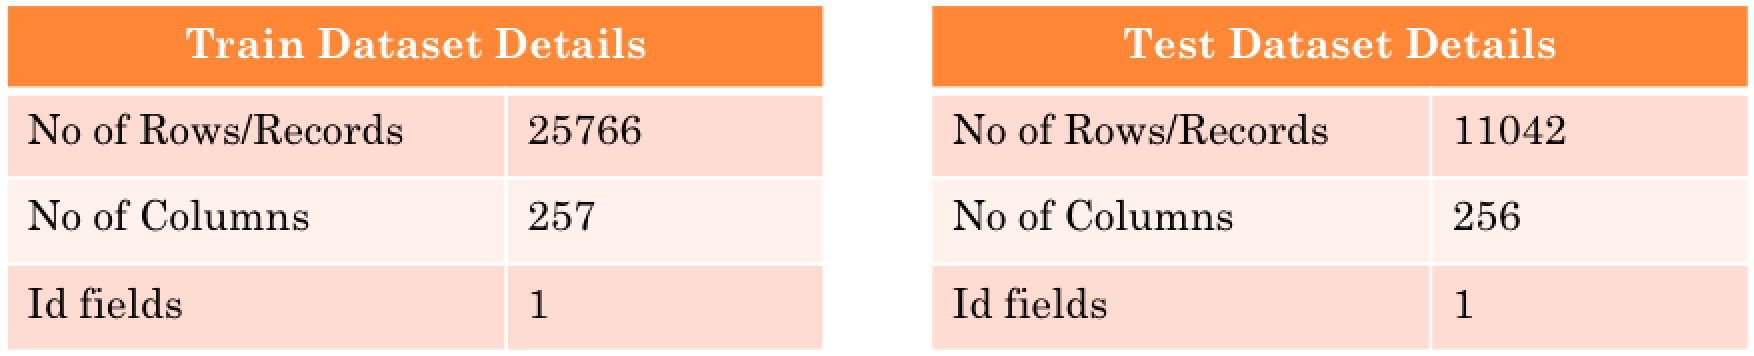
Dimensions of Data
There are two data set as part of this analysis
- Train Data – in this data set the response variable is already present
- Test Data – in this data the response variable need to be predicted
Treating Missing values
-
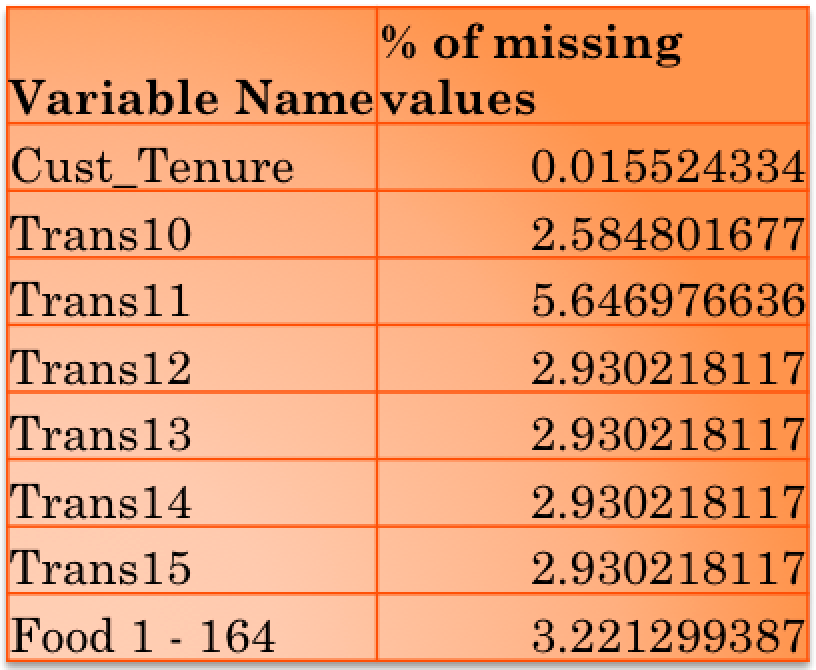
The way missing values are treated depends on the type of variable for which value is missing. Also, the percentage of how much missing values are there for a column
-
For Train data set, the % of value missing were quite low. Following are the percentage of missing values for each variable:
-
As the percentage for each variable is significantly low (less than 3.5 %). The records can be ignored for the analysis
Analyzing Relation b/w variables
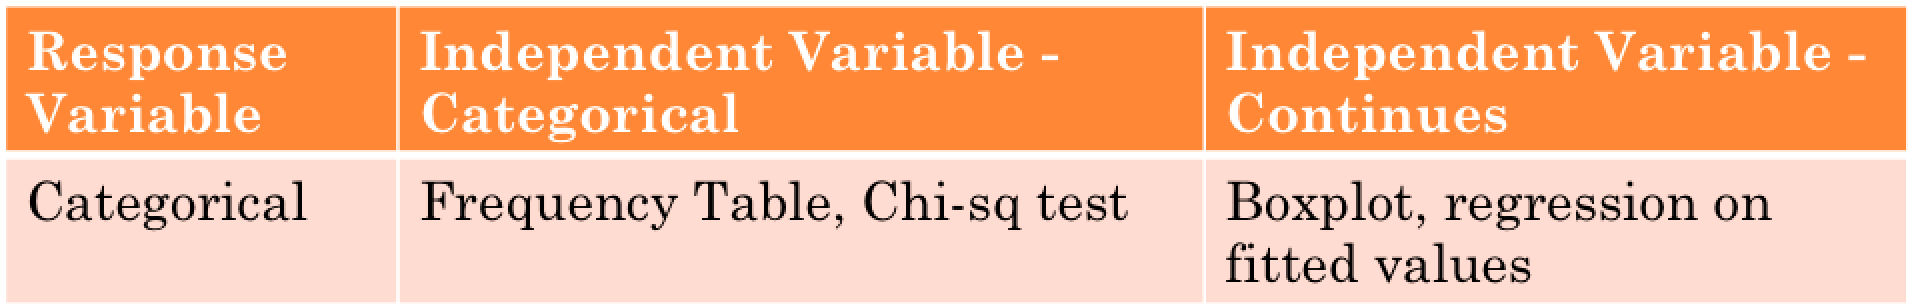
- The response variable in this scenario is – ‘Active_Customer’, which is a categorical variable.
- The ‘Active_Customer’ variable needs to be analyzed against each independent variable to see if there is any relation with the response variable.
- Following are the method used to understand association between response variables and independent variables
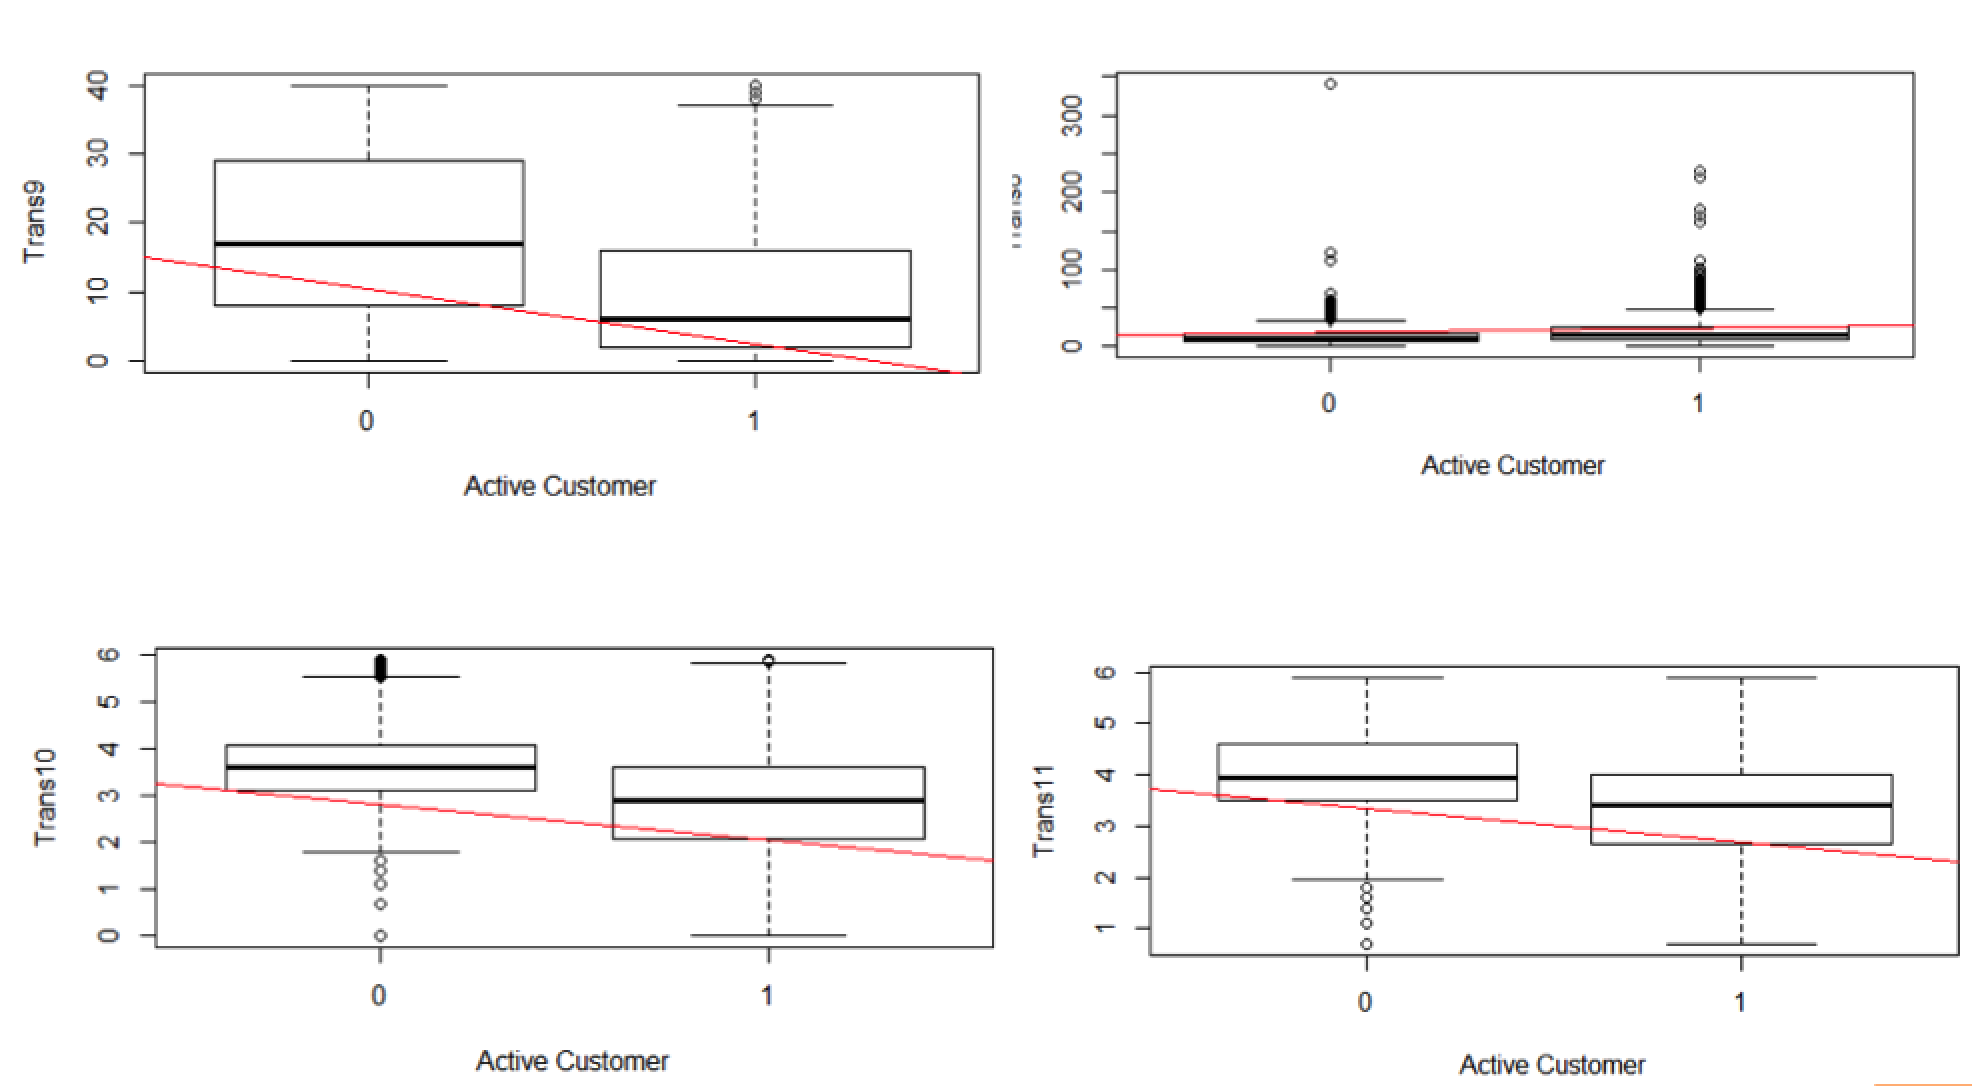
Resulting Plots
Test Data – Treating missing values
- The ‘Test’ data should not have any missing values for the variables the data model is build
- Again the percentage of missing data is calculated for all the variables which are included in the model.
- The percentage of missing value is very low for all the variables (less than 3%). As the percentage is low, the missing values are replaced with mean of that column.
Building a Model – Logistic Regression
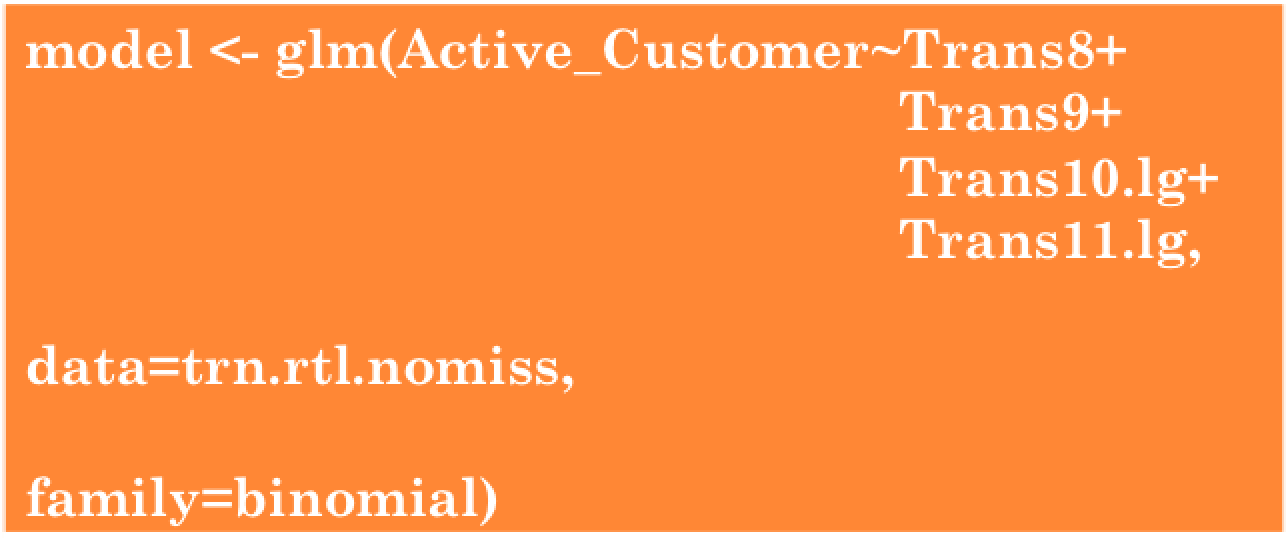
As the response variable is Categorical in this analysis, Logistic regression is used to build a model which fit the value in the train dataset.
In R, glm() function is used to build a Logistic regression model. Below is an example of the glm() function.
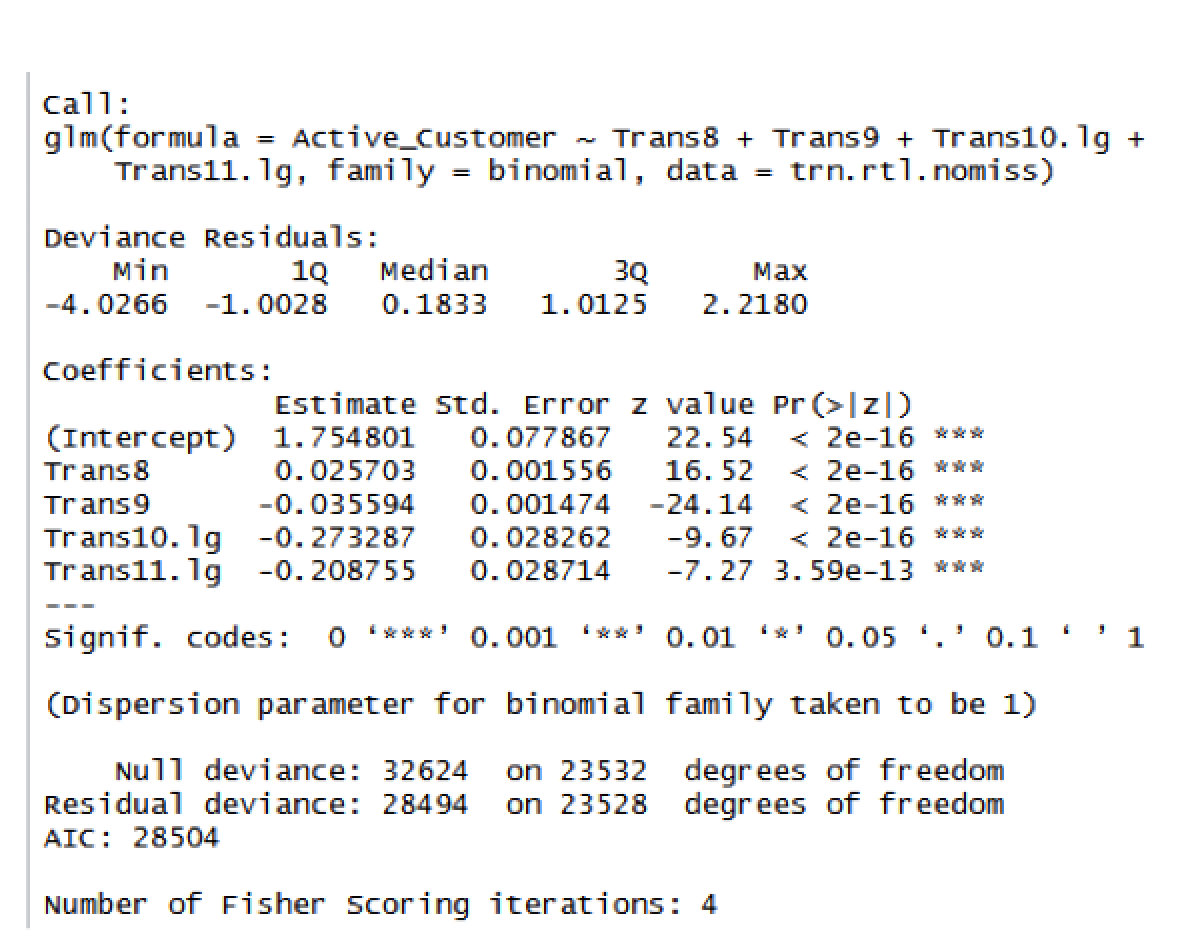
Exploring the Model – Logistic Regression
- The summary function understand the model
- Below is the details
Predicting Values
-
Next step is to use the model build on Train data set to predict values for the Test data set.
-
The predict() function in R is used to predict probability for each value in the provided dataset (which is Test dataset in this case)
-
Following is an example of how predict function is used
 - The output for this function is a positive probability (value less than 1). For example the value
- After applying on the prediction model on Test data set.
- The output for this function is a positive probability (value less than 1). For example the value
- After applying on the prediction model on Test data set.